We have assigned everyone who uses the Live Net Positive Card Game and the Net Positive Life App the same baseline footprint for carbon and nature, based upon accurate UK data.
Our philosophy is that we want everyone to take a shared responsibility for planning their way to net positive, and establishing a universal baseline is the most effective approach in the first instance.
We will improve this element of the app over time, however this will not affect how useful this tool will be to planning your journey to net positive.
How we established the baseline
We have used data collected by various government sources to assign a baseline figure. We have then cross referenced our calculations with other scientific reports and studies done to determine baseline impacts. We accept there are assumptions and missing pieces of data, but believe these are some of the most accurate approaches you can take to establish these figures.
All of our references, calculations and assumptions, may be found in this post on the NetPositiveLifeCommunity – please read and provide comment as appropriate.
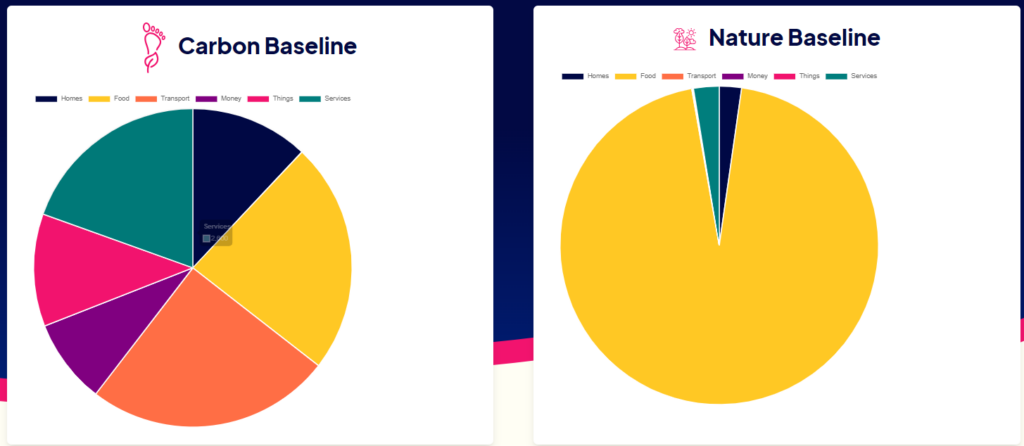
You will need to create an account on the Net Positive Life App to toggle the pie charts and graphs.
Homes
Carbon Footprint Per Person Per Home: 1,600kgCO2e
Ofgem estimates the typical household in Britain uses 3,100 kWh of electricity and 12,300 kWh of gas in a year. Using government conversion factors this provides a baseline impact of 1,195kgCO2e from electricity and 2,580kgCO2e for heating, giving an overall carbon footprint per home of 3,775kgCO2e. The average occupancy of UK properties is 2.36 per household, giving a carbon footprint of a home of 1,600kgCO2 per person.
Impact on Nature Per Home: 300m2
The average floor area from Statista of a UK home is 111m2, with an average garden size of 188m2 (according to Garden Patch). We have therefore allocated 300m2 per household which can be influenced to benefit nature.
Travel
Carbon Footprint Per Person 3,319kgCO2e
We have used transport statistics published by the government to determine the passenger km taken across the UK by cars, rail, buses, aviation (international & domestic) and maritime, and then multiplied this by government conversion factors, giving a total UK passenger transport footprint. We then divided this by the number of people in the UK to reveal 2,819kgCO2 per person. This excluded the carbon footprint of car ownership which is approximately 11,000kgCO2e per car, which over a lifetime equates to around 1,000kg per car. There are 33million cars in the UK with 68million people, allowing 500kg per car to be allocated per person. This gives an overall carbon footprint of 3,319kgCO2e per person.
Impact on Nature by Transport 11.5m2
We have allocated an impact from transport from car ownership, as without car ownership a lot of space could be made available for nature. An average car parking space in the UK is 2.4 by 4.8 meters, equating to 11.52m2.
Food
The underlying data to calculate food impact has come from Our World in Data Food Greenhouse Gas Emissions from the Supply Chain 4. This data has been downloaded and married against Uk Government Data Quantity of food and drink purchased for UK households (averages per person per week) data. 1 This allows for us to determine the average spend against KG of Food, KG Carbon Emissions, Land Use and Water Use.
According to this data which includes a factor of 1.5 used to include food/drink purchased outside of the home we have determined land use and carbon footprint of food which has been checked against other sources.
Carbon Footprint Per Person 3,133kgCO2
Impact on Nature Footprint Per Person 12,642m2
Things
Carbon Footprint Per Person 1,524kgCO2
To determine the impact of clothing we looked to find a baseline of KG of clothes bought by each person each year. We used Statistica Data to establish that the average number of pieces of clothing were 33 pieces. We then found data on the average weight of clothing items from Parcl – averaged this data getting a value of 0.94KG per item of clothing. This was then used it as a multiple to establish the average weight of 31kg.
We could find much data on the average number of shoes bought so we used data in an article from Sun which identified in Britain we buy on average 3 pairs of shoes.To establish the weight of shoes (and for all other assumptions) about environmental impact we found this very useful life-cycle assessment that gave an average value of 1 KG per pair of shoes. Giving 3kg from shoes.
From clothing we calculated the carbon footprint using 23.2KGCO2 per KG of clothes (taken from WRAP report). Giving a carbon footprint of 788.8kgCO2e from clothing.
Technology has values derived from lifecycle assessment (linked here) of 10kgCOe per laptop, 11kgCO2e per tablet, 2.3KG per power tool (hair dryer or power tool) and mobile phone of 21.9kgCO2e. We assumed each person would have at least three of those items, adding 135kgCO2e to their footprint.
Small World Consulting estimate the impact from Newspaper, books and paper as 100kg, and other shopping (excluding food, clothes, shoes and home fabrics) at 500kg, so these have also been added.
Nature Footprint Per Person 10m2
Finding data for land use was really hard. What we did was establish a land use for each item of clothing. To do this we assumed cotton was predominantly used. A report was found identifying the KG per hectare of cotton production in China, to which we used an average finding that 1434KG are produced from 1 hectare. We found a report which gave a value of 8 onces of cotton were needed to produce one teeshirt. We then got a value of 0.158 m3 of land to produce 1 teeshirt. We also thought we’d do the same for a pair of jeans with this report giving a value of 0.68KG of cotton to produce a pair of jeans, giving a value of 0.42 hectares to produce a pair of jeans.
We thought it fair considering these calculations to give a value of 0.3 m3 for an average item of clothing giving a value for 33 pieces of clothing per year of 10m2.
Money
Carbon Footprint Per Person 1,146kgCO2
To determine the impact of money we used data available from MotherTree’s carbon league table and data from the blog moneyfarm. We calculated Mothertree’s league table average carbon footprint per £10,000 (from 16 banks) revealing an impact of 1,146kg.
Impact on Nature Per Person ?m2
There is no data linking the impact of banks on nature, and indeed investments. There are untold impacts though as banks invest in mining, intensive agricultural practices, intensive fishing, as well as allowing investments to result in deforestation. Problem is the overlap between food and consumables by people – we have therefore assigned no impact on nature until more data is available.
Services
Carbon Footprint Per Person 2,600kg
We have taken these figures directly from Small World consulting who grant 900kg to spending on non-physical items, such as internet, home insurance, rent or mortgage payments, memberships and subscriptions, and all professional services. The companies that provide these services have a carbon footprint, even though their products are intangible. The more you spend, the higher the footprint is likely to be. And 1,700kg to construction industry and the provision of public services such as education, health, police and defence. Some people will consume more of these services than others, but we’ve fixed the slider because there’s little that individuals can do to directly control their slice of these emissions.
Impact on Nature Per Person 346m2
We looked at the land run by the government. The MOD own 232,300 hectares of land, which equates to 34.5m2 per person in the UK. The Office of National Statistics lists Publicly Accessible Green space and Functional green space at 209,410 hectares of land, which equates to 31.1m2 per person in the UK. The Crown Estate, indirectly governed by the UK government, has 106,000 hectares under agricultural farming, and mineral extraction of 115,500 hectares, totalling 221,500 hectares, equating to 32.9m2 per person in the UK. Organisations such as the national trust can be included in this, which owns 250,000 hectares of land, equating to 37.1m2 per person. We thought it reasonable to include National Parks as well, as these are on the frontline of government policy: There is 16,267 square kilometres of national park equating to 241m2 per person.
Although farmland is influenced by National Government and could be included in this calculation, we have decided to exclude it as there is considerable overlap with food.